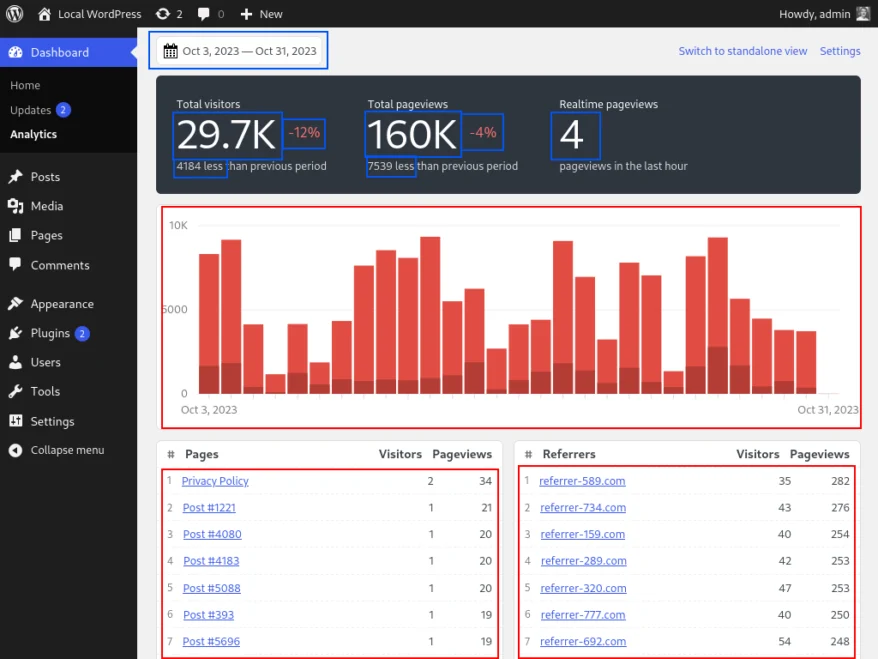
This morning, we released version 1.3 of Koko Analytics. You may have noticed the dashboard loading a lot faster. In this post we will go into some of the technical details that made this happen.
TLDR: We reduced total page weight for the Koko Analytics dashboard by over 95% by moving it outside of WordPress admin and replacing React with vanilla JavaScript.
In previous versions, opening up the Koko Analytics dashboard with an empty browser cache required you to download 280 kB of compressed data spread out over 22 HTTP requests.
With more and more of WordPress admin starting to depend on React, we figured that everyone would have it in their browser cache already. We initially decided to follow suit and switched out Preact for React. This caused total page weight to grow to around 310 kB (after compression) spread out over 27 HTTP requests.
Synthetic performance testing on mobile using Lighthouse estimated the First Contentful Paint occurring at around 2.2 seconds.
Any thoughts of spending time to optimize these numbers were quickly discarded because any gains we would be able to make in the Koko Analytics plugin would be dwarfed by the fact that the dashboard was embedded in WordPress admin.
For reference, just loading the Gutenberg editor requires you to pull in 2 MB of compressed data (8 MB uncompressed). So WordPress admin is already pretty much unusable on slower connections or lower end devices.
Everything changed when we started looking into allowing our users to make their analytics dashboard publicly available. We were already running a public demo on this site right here, but that was developed by creating a new user with only one capability: to view Koko Analytics.
A much cleaner solution would be to offer a standalone dashboard page. One that didn’t live inside WordPress admin.
Standalone dashboard: performance go brrrr 🚀
I set out to work with the goal of pulling the dashboard page out of WordPress admin. Since everything was rendered client-side, this was an easy change. The first results were promising:
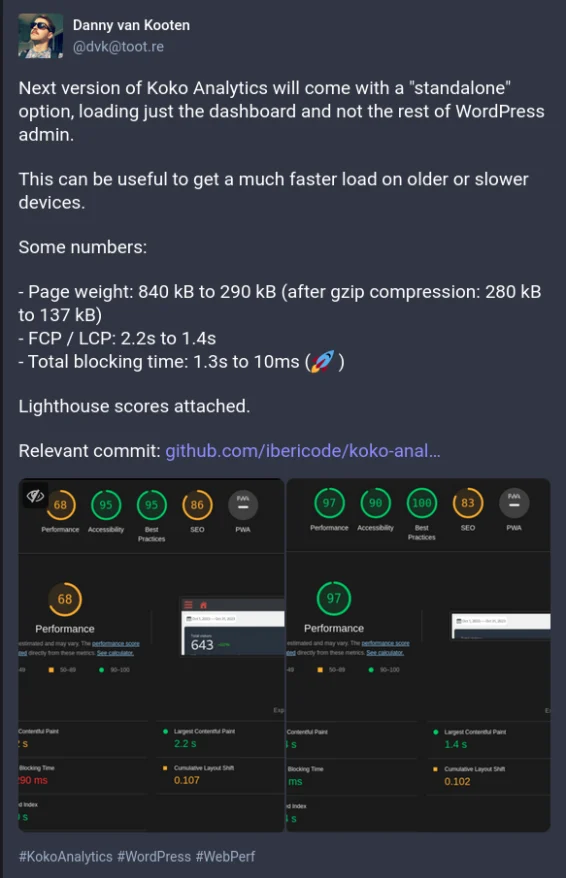
Page weight was down to 137 kB, well over half of what it used to be. According to Lighthouse, the First Contentful Paint also improved considerably to 1.4 seconds.
Replacing React with Preact again? Or Svelte, Vue, htmx?
Now our page was isolated from WordPress admin and thus no longer loading all kinds of unrelated CSS and JavaScript, I was not ready to just stop here and call it a day.
React was still responsible for about 50 kB of minzipped data. Switching back to Preact would reduce this to only 5 kB while also scoring slightly better than React in the runtime performance benchmarks we looked at.
Side note: Bundlephobia is a neat little tool to check the minzipped size of NPM packages. Beware that it sometimes doesn’t give the true size though, eg when checking “preact/hooks”.
While looking at other options, I was looking for something that would come with a smaller bundle size, better runtime performance and ideally allowed us to re-use parts of our JSX or rendering logic.
- Vue scores quite good in terms of runtime performance, but at 35 kB it wouldn’t help much for our start-up metrics.
- Svelte’s approach looks refreshing and it scores well in terms of start-up metrics, but introducing yet another build step isn’t what I was after.
- htmx has been piquing my interest lately, but would require a separate set of endpoints that served HTML instead of the current JSON endpoints through the WordPress REST API.
Being a big fan of Lichess and its open-source model, I knew they were using a performant virtual dom implementation called snabbdom combined with vanilla JavaScript.
After some experimentation, I started replacing React components with server-side rendered HTML which was then augmented using vanilla JavaScript. Where it made sense to do so, like in the SVG mark-up for our chart component or in the bodies of our table-like components showing the most viewed posts or top referrers, virtual DOM based patching was used.
The 50 kB dependency on React was now replaced with about 3 kB worth of snabbdom. Not only that, but since so much logic and HTML generation had now moved to the server, almost all localized strings were now being localized on the server. With a few more minor changes, we would no longer need a localization implementation on the client-side at all.
Removing wp-i18n, which in turns loads wp-polyfill, removed another 50 kB worth of compressed JavaScript that browsers no longer have to load or process.
Same dashboard, completely different codebase. Was it worth it?
Let’s look at some numbers first.
| WP Admin + React | Standalone + React | Standalone + vanilla JS | |
| Total page weight (uncompressed) | 890 kB | 290 kB | 42 kB |
| Total page weight (gzipped) | 280 kB | 137 kB | 14 kB |
| First Contentful Paint | 2.2 s | 1.4 s | 0.8 s |
| Number of HTTP requests | 22 | 27 | 3 |
| Memory use | 58 MB | 66 MB | 40 MB |
By moving the dashboard outside of WordPress admin, replacing React with vanilla JavaScript + a tiny bit of snabbdom, we:
- Reduced total page weight from 280kB to 14kB.
- Reduced the total number of separate HTTP requests from 22 to just 4.
- Improved the First Contentful Paint metric from 2.2s to 0.8s.
In case you’re wondering what difference the fewer number of HTTP requests makes now that HTTP/2 is so wide-spread, it still matters, especially for compression rates.
Lines of code is far from a perfect metric, but I think it does give a sense of underlying complexity. Using cloc to count lines of actual code, excluding developer tooling, gives us the following numbers:
- Lines of JavaScript: 102.000 to 3800
- Lines of PHP / HTML: 1300 to 1500
- Lines of CSS: 280 to 380 (due to getting rid of our CSS-in-JS).
Personally, I’m super stoked about these results.
Preact was a great option for quickly getting a prototype out there, but over time we added some things to the client-side application which should probably have just been rendered on the server.
Arguably the dashboard was already plenty fast for WordPress admin users since the bulk of JavaScript that we depended on should already be in browser cache, but the improvements are so huge that even these users will notice.
And with version Koko Analytics version 1.3 allowing you to make your analytics dashboard public, these performance improvements become even more important.